Monopoly Rent Rush Mechanics: Visualizing Extreme Volatility
A masterclass in extreme volatility: We strip away the Monopoly animation to reveal the probability engine hollowing out the middle of Monopoly Rent Rush. Visually map the heavy tail of a 17,497x max win state machine.
Published
Quick Verdict
- Verdict
- A masterclass in extreme volatility: We strip away the Monopoly animation to reveal the probability engine hollowing out the middle of Monopoly Rent Rush. Visually map the heavy tail of a 17,497x max win state machine.
This guide is part of our Game Mechanics series — covering the mechanics, math, and strategy behind modern slot design.
Best Casinos to Play These Slots
Top-rated casinos recommended for the slots covered in this guide.
Decoding Monopoly Rent Rush: Where Math Meets the Heavy Tail
Let me paint a picture you know all too well. You are sitting there hitting the spin button while waiting for Mr. Monopoly to finally stack those hotels and multiply your rent. When that feature actually triggers and the board goes wild, it feels like pure magic. But after spending over fifteen years in the gambling industry looking closely at how these games actually tick, I can promise you that this magic is a very deliberate flavor of probability modeling.
A slot machine is not just a bunch of physical reels spinning around. It is a highly tuned probability distribution engine wrapped in a flashy visualization. What really makes one game feel completely different from another is not the return to player percentage. The true difference lies in how the payout value gets scattered across the infinite possibility of outcomes. So let us grab a coffee, head to the whiteboard, and look at the actual math that drives your session.
Every single spin you take is governed by the core Expected Value formula:
Here we have X representing the payout of a single spin. The term pᵢ is the probability of a specific outcome happening, and xᵢ is the actual cash payout for that specific outcome. The Expected Value E[X] is simply your long term average value per spin. This equation represents the absolute mathematical certainty of the house edge. If a game states an RTP of 96 percent, then over millions of trials the expected value will absolutely settle at 0.96 times your bet size.
Monopoly Rent Rush operates firmly within this stable mathematical framework using these published specifications:
| Published Metric | Value | The Real Player Translation |
|---|---|---|
| RTP | 96.07% | The long term mathematical return. This number is completely stable across millions of trials but tells you absolutely nothing about the wild ride you will experience in a Friday night session. |
| Hit Frequency | 32.19% | How often some winning outcome actually lands. A high hit frequency can totally coexist with extreme variance. Most of these hits are just tiny fractional wins designed to keep you engaged while your balance slowly drains. |
| Max Payout | 17,497x | The defining characteristic of an extreme heavy tail distribution. Hitting this is a statistical miracle. Chasing this exact number defines the entire volatility curve of the game. |
The problem is that published RTP and max payout numbers only give you the start and finish lines. They tell you nothing about the actual terrain you have to cross. They do not explain why a game with a hit every three spins can feel like an absolute desert for two hours until it suddenly unleashes a massive cascade in ten seconds. To understand that feeling, we have to look past expected value and dive into variance partitioning. We need a visual model of what the math is actually doing.
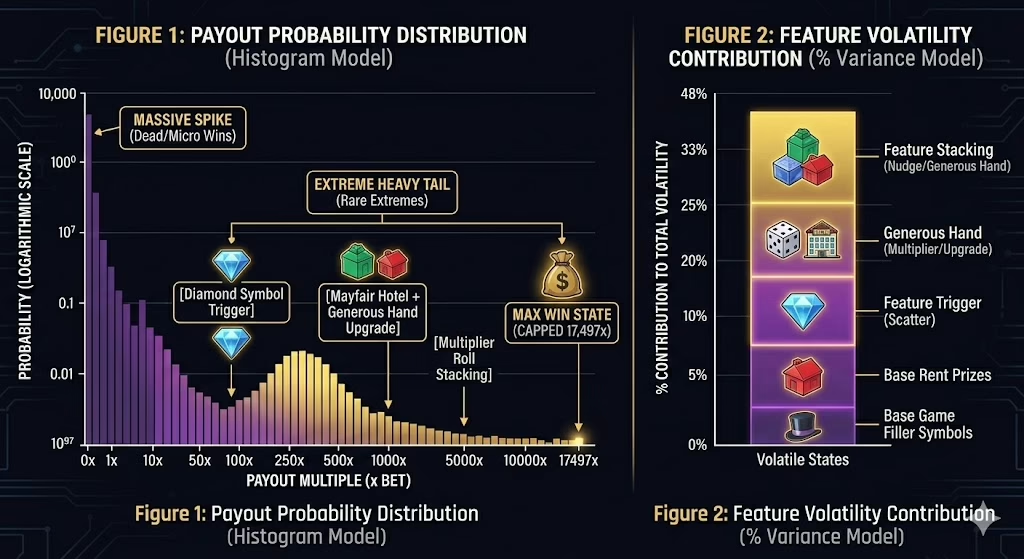
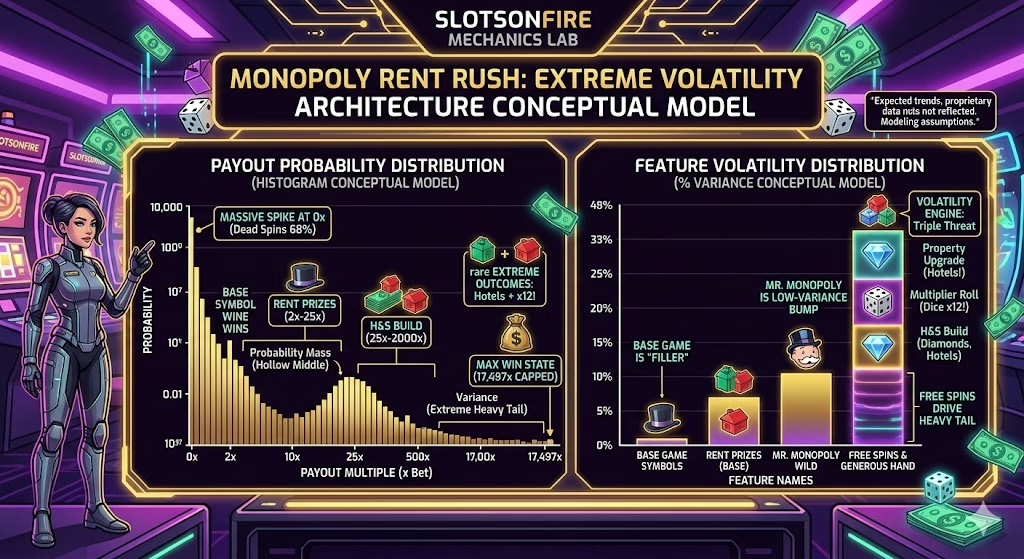
Figure 1 (Left): Payout Probability Distribution showing an Extreme Heavy Tail. Figure 2 (Right): Feature Volatility Contribution indicating where the risk and reward are concentrated.
Decoding the Distribution: Why Long Tails are Thrilling
This image is basically the holy grail of high variance slot engineering. Look at Figure 1 on the left. This is a Payout Probability Distribution histogram. If this was a friendly game that paid out constantly in small chunks, this graph would look like a narrow little hill. But Monopoly Rent Rush is definitely not a narrow hill. It is a massive flat plain defined by the giant spike of dead spins and micro wins sitting right near zero.
This giant spike is where your session lives for 95 percent of the time. It is filled with outcomes that pay nothing or maybe twenty cents on a dollar bet. This dead zone in the graph is a strict statistical necessity. In order for the math engine to afford a 17,497x miracle payout while maintaining that 96 percent RTP, it has to aggressively claw back value millions of times in the base game. When you feel like a slot is ice cold and just eating your balance, you are visually and statistically trapped right inside that massive plain.
Now shift your attention to Figure 2 on the right. This single stacked bar shows exactly where the actual risk is distributed in the game code. You might logically think the base game filler symbols carry the most weight because you see them constantly. They actually do not. Their contribution to the total variance is minuscule because they pay out practically nothing. The base game is just an empty waiting room.
The entire game system is built from a series of nested state machines designed specifically to propel you all the way down that extreme heavy tail in Figure 1. Figure 2 proves that almost all the real value is concentrated in the absolute top layers. The true engine runs on the Scatter Trigger, the Generous Hand Upgrades, and the Feature Stacking.
The visual journey you experience on the screen is actually a very strict linear progression through these mathematical states:
- The Diamond Symbol Trigger: Landing those Scatters is your entry ticket. Until this specific event happens, your session is statistically flatlining. Figure 2 clearly shows this is where the real volatility finally begins.
- Mayfair Hotel Plus Generous Hand Upgrade: Once you are inside the feature, the system attempts to build value. Landing four Houses triggers the Property Upgrade and turns them into a Hotel which can pay up to 1,000x rent. This is your first major milestone on that long tail in Figure 1.
- Multiplier Roll Stacking: Now the math requires the Generous Hand state to trigger an active Multiplier Roll at the exact same time. Just getting a Hotel is not enough to break the game. You need that multiplier cascading across all your outcomes to really climb the tail.
- The Max Win State: This is the ultimate mathematical miracle. It happens when the Nudges and the Generous Hand and the Multipliers and the Hotels all align in perfect sequence. Notice how Figure 1 has a dedicated tiny spike for this state sitting way out on the far right. Reaching this specific point mathematically terminates the feature because it literally hits the ceiling of the pay table model.
This kind of architecture is completely intentional. When you view modern slots structurally, they stop looking like random chance and become fascinating studies in distribution modeling. We are not just blindly pressing a button hoping for luck. We are paying a premium for the chance to navigate a complex state machine and land on the extreme right tail of a mathematical curve. And once you truly understand the shape of that curve, the whole ride becomes incredibly fun.
Tags
Andrew Mueller is the founder of SlotsOnFire and holds a B.S. in Electrical Engineering (BSEE). Since 2008, he has leveraged his analytical background to deconstruct complex slot mechanics, focusing on the mathematical integrity and algorithmic logic behind RNG systems.